Estimating UBER Prices by Analyzing Twitter Feed
Uber is a worldwide transportation network company which allows users to request a ride using their smart phone. Not only is it convenient for consumers but also serves as a very flexible source of additional income for most drivers. Uber uses an algorithm to increase prices to “surge” price levels, responding rapidly to changes of supply and demand in the market, and to attract more drivers during times of increased rider demand. As a driver, it would be extremely beneficial to know what time of the day and the area in which I am probable to make the most amount of money. Since this service provides a lot of autonomy to the driver in terms of when he/she is willing to work, it is particular interest to find out which area they should be in to maximize their revenue based on time of day.
The objective of this project is to utilize these data points to determine where a Uber driver should be to maximize his earnings. A real time detection of traffic can be found out by analyzing twitter stream. The system fetches tweets according to certain criteria and will be used to model traffic for our forecast.
DATA SOURCES:
- Twitter Data Stream
Tweepy is an easy to use python library for accessing the twitter API. The API class provides access to the entire twitter RESTful API methods including the twitter streaming API which is used to download twitter messages in real time. The stream method was used as compared to just getting historic tweet data as I also needed to connect the data with estimate of uber price at that particular moment. So in the same method there is call to the Uber API to get the estimated price at that particular geo location.
The only filter in the search query would be location which is specified using the binding box geo coordinates of the city which you want to analyze.
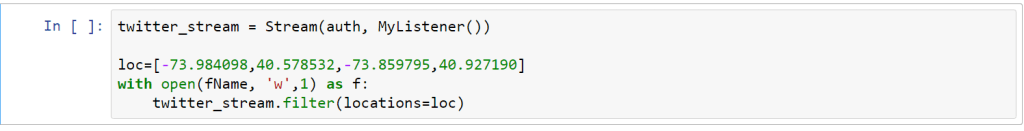
Tweeting with location is a geo-tagging feature in the twitter API and it has to be enabled by the user for the data to have geo coordinates in them when it is collected. So location is preferentially taken from the Geotagging API, but will fall back to their Twitter profile. So it will give all tweets that have geo coordinates in the area mentioned above or if it blank then it will also retrieve all tweets from users who are in the given location. This can be misleading for our analysis as a user may be belong to a particular city but may be tweeting from another location altogether. Hence I have considered only tweets which had geo coordinates in them to restrict our data set to tweets which are genuinely from our desired geographical location.
- Uber API
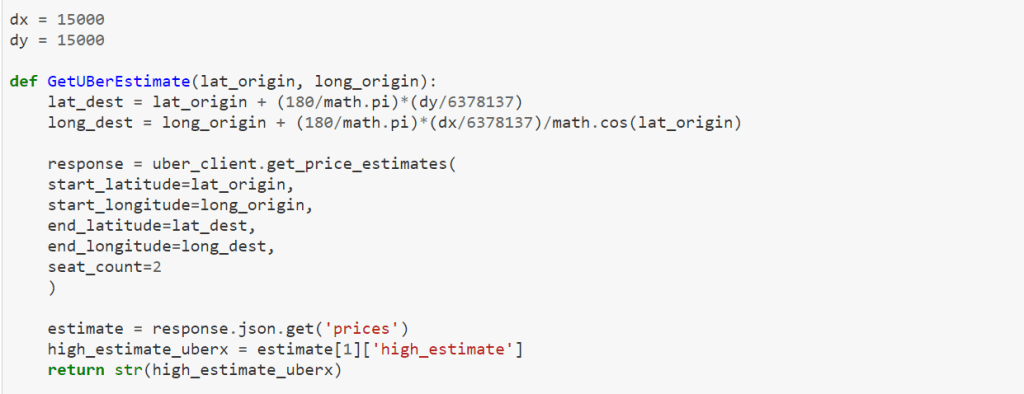
The get_price_estimate method returns an estimated price for each product given the coordinates of the starting and ending location. When surge is active for a particular product, its surge_multiplier will be greater than 1, but the price estimate already factors in this multiplier. In order to get the coordinates of the destination , an algorithm is used which when given a latitude and longitude pair and a vector translation in meters, it returns a new lat-long pair which is essentially an offset in meters from the original coordinates.
ANALYSIS:
Intuitively one would assume that the most important factors affecting the price of an Uber ride would be the demand. Various factors can drive the demand of a cab at any given time.
- Neighbourhood
The location of an area has significant impact on the demand for a cab. There are certain neighbourhoods which busier and will have a higher proportion of people tweeting which can indicate that there are more users requesting a cab in that location. The histogram below in which the city is divided into 36 neighbourhoods and each neighbourhood is assigned a code shows that there are certain neighbourhoods where the number of people tweeting is significantly higher than others.
- Bag of words
The main challenge in this project is to analyze each individual tweet and to predict which of them can be identified as having a correlation with the demand for a cab at that particular point in time. The first part is to identify the most frequently occurring hashtags, words and bag of words. While doing this it is important to note that there has to be an array of items which need to be ignored for our analysis. This array is called the stop term and it includes punctuations, emojis, prepositions and city specific words. These can be excluded using regular expressions.
The initial analysis shows that these words have a higher correlation with high estimated prices and is chosen as our bag of words.
- Time
The price estimate varies not only on the time but also on the day of week. For example 9pm on a friday night intuitively will have a higher demand than 9pm on Tuesday night whereas 7 am Saturday will have less demand than 7 am Monday. So to avoid collinearity a single independent variable must be used which is hour of week. Hour of week is calculated as (Day_of_week)*24 + Hour_of_day. Our analysis shows that there are certain hours of week where the price estimate is significantly higher than the average. The chart below shows that hours 115 to 120 and 140 to 145 have clearly higher estimate as surge multiplier may have been active during those times.
REGRESSION MODEL:
We have used a multivariable linear regression model to estimate the price based on our independent variables. In the least-squares model, the best-fitting line for the observed data is calculated by minimizing the sum of the squares of the vertical deviations from each data point to the line.
yi = 0 + 1xi1 + 2xi2 + … pxip + i for i = 1,2, … n.
According to our prelimnary analysis the following 3 variables are considered independent and seem to have an impact on our estimate.
- Neighbourhood
- TrafficRelatedTweet
- Time of Week

